

Sustainability
-
The page you are looking for has been closed.
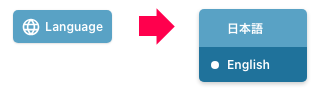
To view our sustainability information in English,
Please select "English" from "Language" at the bottom right of the Japanese page.
-
The page you are looking for has been closed.
To view our sustainability information in English,
Please select "English" from "Language" at the bottom right of the Japanese page.